Education Moments
Raynmakers, did you know that the Unemployment Rate that U.S report monthly is the biggest BS data?
Here’s why:
The BLS(Bureau of Labor Statistics) defines a person as “employed” if they worked at least 1 hour for pay during the survey reference week. Not 4 hours — just 1.
So someone who worked a single hour delivering food on Tuesday and did nothing else all week is counted as “employed” in the U-3 headline number reported alongside NFP.
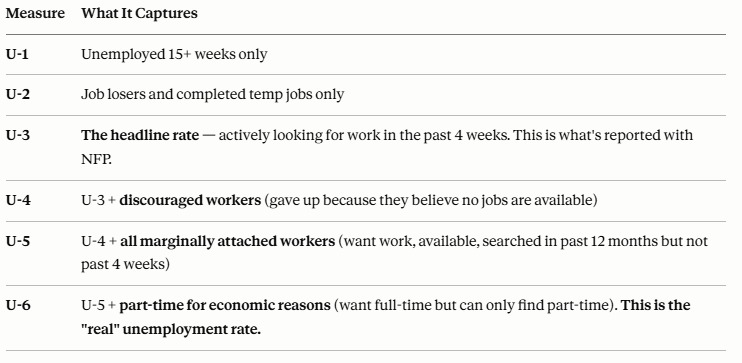
This is why the headline unemployment rate can be misleading. The official U-3 rate doesn’t take into account discouraged workers who have given up looking for work, and it leaves out underemployed workers — including involuntary part-time workers — who, although technically employed, are underutilized, representing hidden slack in the labor market.
WHY THIS MATTERS FOR TRADING
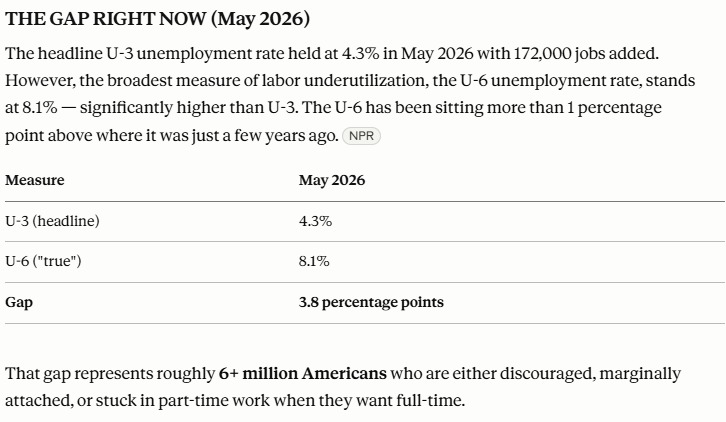
The U-6 is the number that tells you whether the labor market is actually tight or just looks tight on the headline. Right now:
- U-3 at 4.3% looks “okay” – not great, not terrible
- U-6 at 8.1% tells you there’s real slack underneath – the labor market is weaker than the headline suggests
Across all measures of underutilization, labor market conditions today remain worse than pre-pandemic norms.
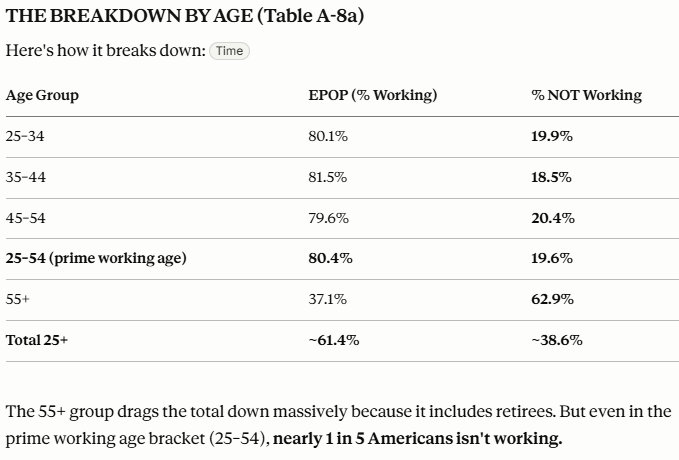
But what we should be looking at is (EPOP), here is why:
The Employment-to-Population Ratio (EPOP)
Everyone aged 16+, what percentage actually has a job?
– Current EPOP: ~59.3%
– That means 40.7% of working-age Americans are not employed – for any reason (retired, disabled, student, homemaker, discouraged, incarcerated, simply not looking)
– No excuses, no filters, no “actively seeking” qualifier
For the prime working age group (25–54), the participation rate is ~83.5%. That means even among people who should be in their peak earning years, roughly 1 in 6 isn’t working.